GHG Emission
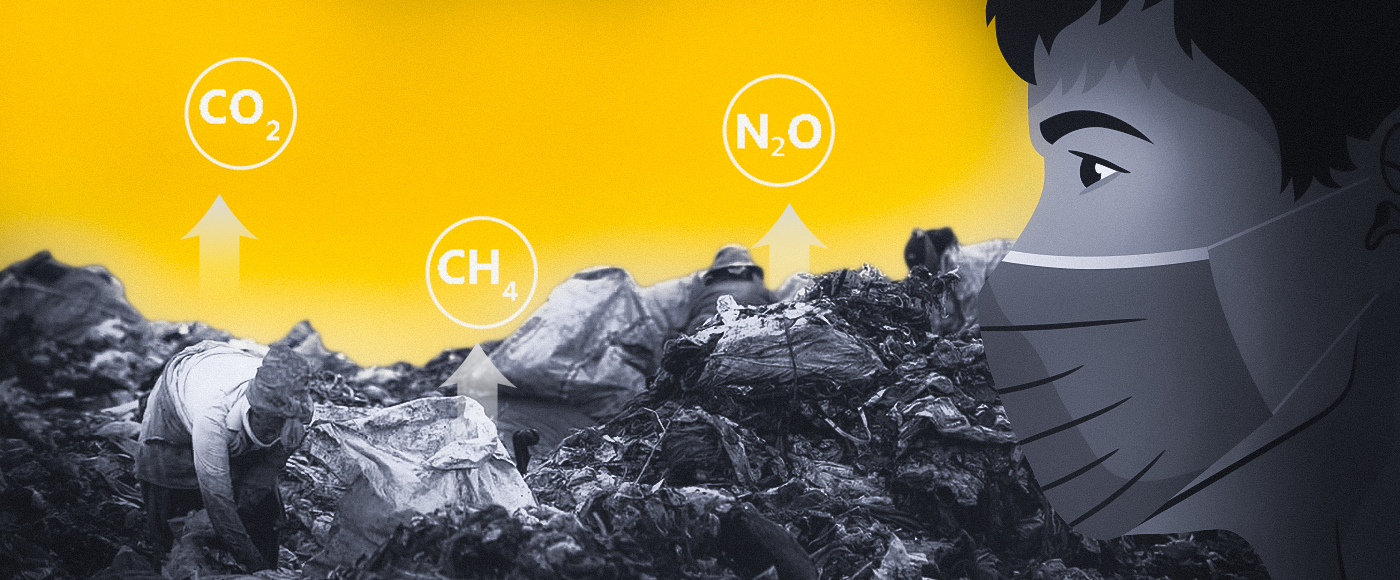
GHG emissions refer to the release of greenhouse gases into the atmosphere. Major components of greenhouse gases are carbon dioxide (CO₂), methane (CH₄), nitrous oxide (N₂O), and fluorinated gases. GHG emissions originate from various human activities, including energy production, transportation, agriculture, industrial processes, and waste management. The following presents the GHG emission/ removal and net value of the three different periods The net GHG emissions of 28,166.06 Gg CO2-eq were estimated for Nepal in the base year 2011. The trend indicates a reduction in net emissions in the first period, followed by a subsequent rise, suggesting that while emissions initially decreased, they later rose, possibly due to increased economic activity or reduced mitigation measures.
Chart 1: GHG Emission (Gg) in Three Inventories

Source: Third National Communication (TNC),2021, Ministry of Forest &Environment (MoFE)
Table 1 provides a sectoral breakdown of greenhouse gas (GHG) emissions and removals/sinks in CO2-equivalent (CO2-eq). The major contributors to the emission are the energy and AFOLU (Agriculture, Forestry, and Land Use) sectors, which have little contribution to waste. The AFOLU sector is notable for having high emissions and removals, indicating significant mitigation potential through land management.
Table 1: GHG Emission and Removal/Sink (Gg*) as per Sector/Sub-Sector, 2010/11
Note: 1 Gg = 1,000 tonnes and this unit is used to measure emissions and removals of greenhouse gases (GHGs) and carbon dioxide (CO2)
Source: Third National Communication (TNC),2021, Ministry of Forest &Environment (MoFE)
Generation and Collection of Solid Waste
The following Table 2 presents the waste collection by their type in the municipalities. It shows that for all municipalities organic waste was higher than inorganic and other types of waste at that period. Average daily waste collection per municipality equals 6.1, 5.9, and 6.1 mt respectively for the three years. The data reveals several challenges, including under coverage that seems like inadequate data collection practices and poor record-keeping system across municiplities. To address these issues, it is essential to develop infrastructure and train manpower for more effective data collection. Similarly, effective awareness programs should be implemented to improve waste management practices.
Table 2: Annual Average Waste Collection per Municipality by Waste Types and Categories, 2020
Source: Waste Management Baseline Survey,2020, National Statistics Office (NSO)
The following table shows the average quantity of waste collected from different sources. The quantity of waste collected was higher among the metropolitan cities accounting for 37340 kg/day per metropolitan city and the quantity of daily waste collection was higher in the households (15920 kg/day) followed by business houses (7720 kg/day).
Table 3: Average Quantity of Waste Collected from Different Sources and Municipal Categories, 2020
Source: Waste Management Baseline Survey, 2020, National Statistics Office (NSO)
Solid Waste Account
Solid waste accounts are useful in organizing information on the generation of solid waste and the management of flows of solid waste to recycling facilities, controlled landfills, or directly to the environment. All available information on waste collection, treatment, and disposal is presented in the following physical supply and use table (PSUT).
The following supply table provides information about the generation of waste by households, business houses, health institutes, etc. which classifies the waste into different types such as organic waste, plastics, metal, glass, rubber, etc. The total amount of waste generated from the country is approximately one million mt/year, of which 3,86,690 mt/year is contributed by households and 2,45,884 mt/year by business houses. Due to the poor record keeping system, the amount of solid waste is higher in unclassified types. So, proper record-keeping systems should be maintained across municipalities by trained manpower.
Table 4: Solid Waste Supply Table for All Metropolitan Cities, Sub-Metropolitan Cities, and Municipalities of Nepal, 2022
Source: -Solid Waste Account for Urban Municipalities of Nepal,2022, National Statistics Office (NSO)
Table 5 presents the total solid waste use quantity (mt/year) for all metropolitan cities, sub-metropolitan cities, and municipalities of Nepal. The data shows that the total waste generated in Nepal is approximately one million mt annually. The largest use sector is landfills where 39 percent of the solid waste is managed and the second major use sector is the environment(surroundings) where nearly 32 percent is thrown. This is a great challenge; to address this, it is essential to develop sanitary landfill sites in every urban municipality to manage the collected waste.
Table 5: Solid Waste Use Table for All Metropolitan Cities, Sub-Metropolitan Cities, and Municipalities of Nepal, 2022
Source: - Solid Waste Account for Urban Municipalities of Nepal, 2022, National Statistics Office (NSO)
Key Takeaways
GHG emission and waste management are closely linked to the residuals generated by human production and consumption process, management, and final release to the environment in the form of solid, liquid, and gaseous materials. Nepal's problems originate from its dependency on fossil fuels, deforestation, land use changes, growing urbanization, and poorly managed waste. To solve these issues, it is essential to prioritize renewable energy adoption and practice appropriate waste management practices.


