Areas, Population, and Sex Ratio
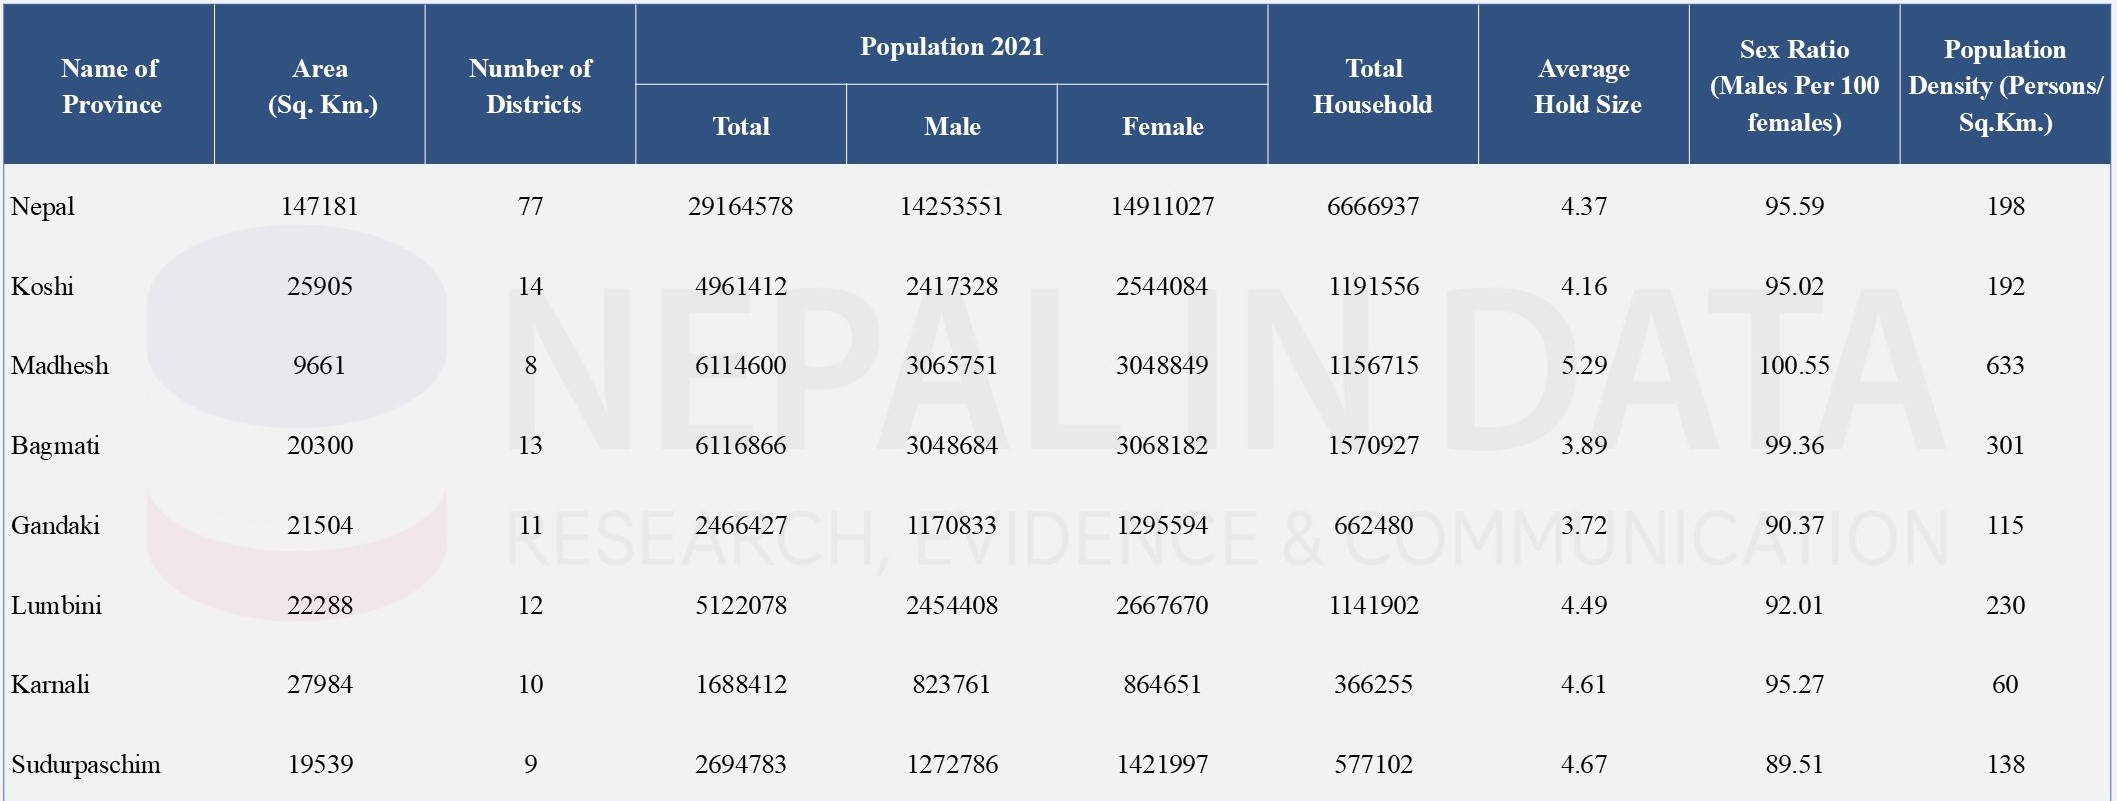
The following Table 1 presents the area, population, and sex ratio at the province level in Nepal. The demographic data reveals significant disparities among the provinces of Nepal in terms of population, density, household sizes, and sex ratios. These factors are crucial for developing effective policies for sustainable development, resource allocation, and social welfare and for improving the quality of life for its diverse population.
Table 1: Areas, Population, and Sex Ratio at the Province Level, Nepal, 2021
Source: National Population Census, 2021, Reports, National Statistics Office (NSO)
Population Growth Rates
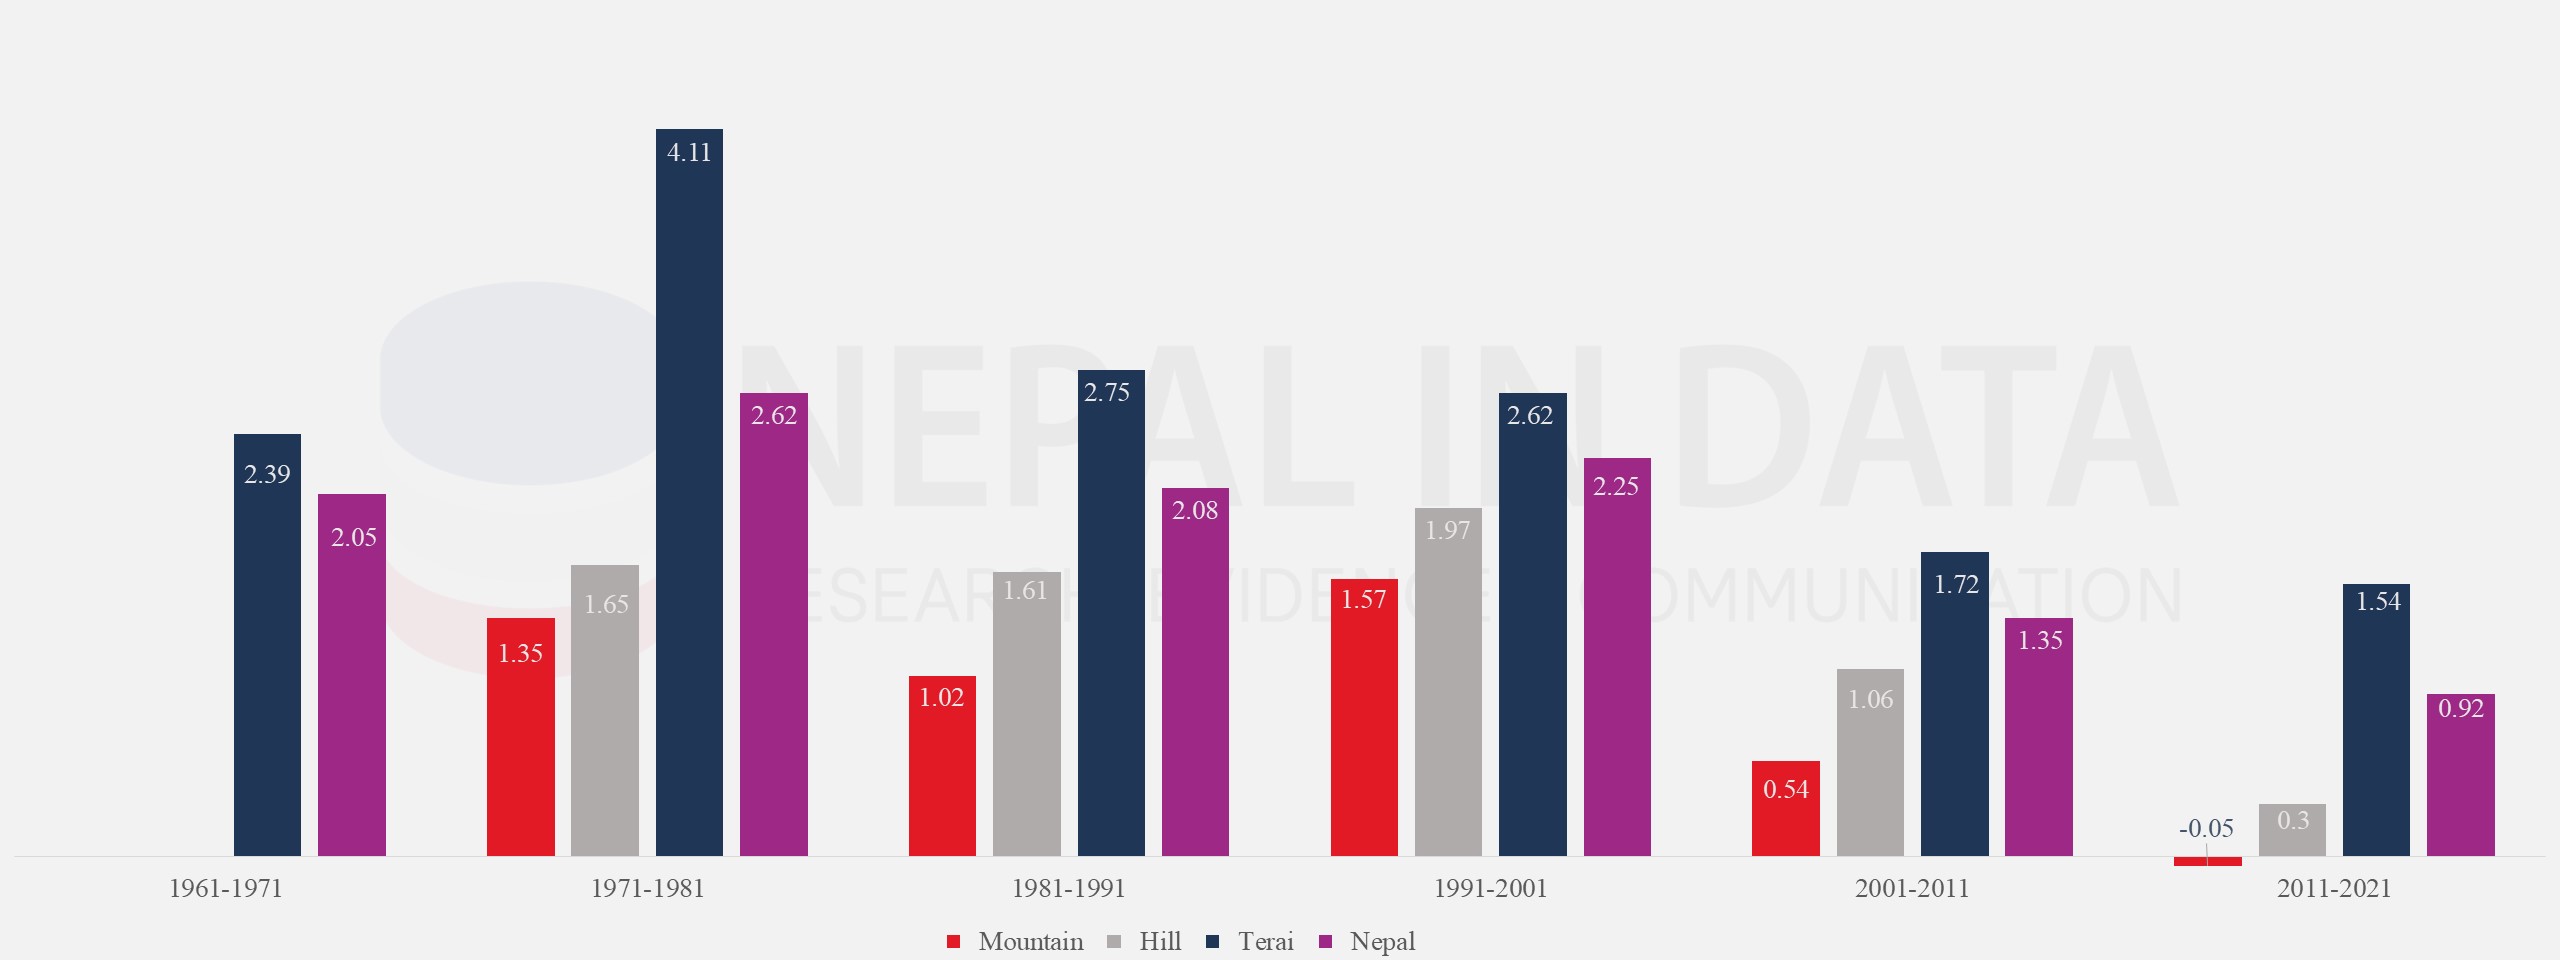
Chart 1 presents the average annual growth rates of the population in Nepal into three geographical regions: Mountain, Hill, and Terai. Nepal's overall growth rate declined from 2.62% in 1971-1981 to 0.92% in 2011-202. Internal migration patterns need to be addressed, especially from the Mountain to the Hill and Terai regions and rural to urban areas, by creating incentives for people to settle in less populated areas, thereby alleviating pressure on urban resources.
Chart 1: Population Growth Rates by Ecological Belt, Nepal
Source: National Population Census, 2021, Reports, National Statistics Office (NSO)
Chart 2 presents the average annual growth rates of the population across different provinces in Nepal from 2011 to 2021. Provinces with higher growth rates, such as Lumbini and Madhesh, may require enhanced infrastructure, services, and resource planning to accommodate growing populations.
Chart 2: Population Growth Rates by Province, Nepal, 2011-2021
Source: National Population Census, 2021, Reports, National Statistics Office (NSO)
Type of House
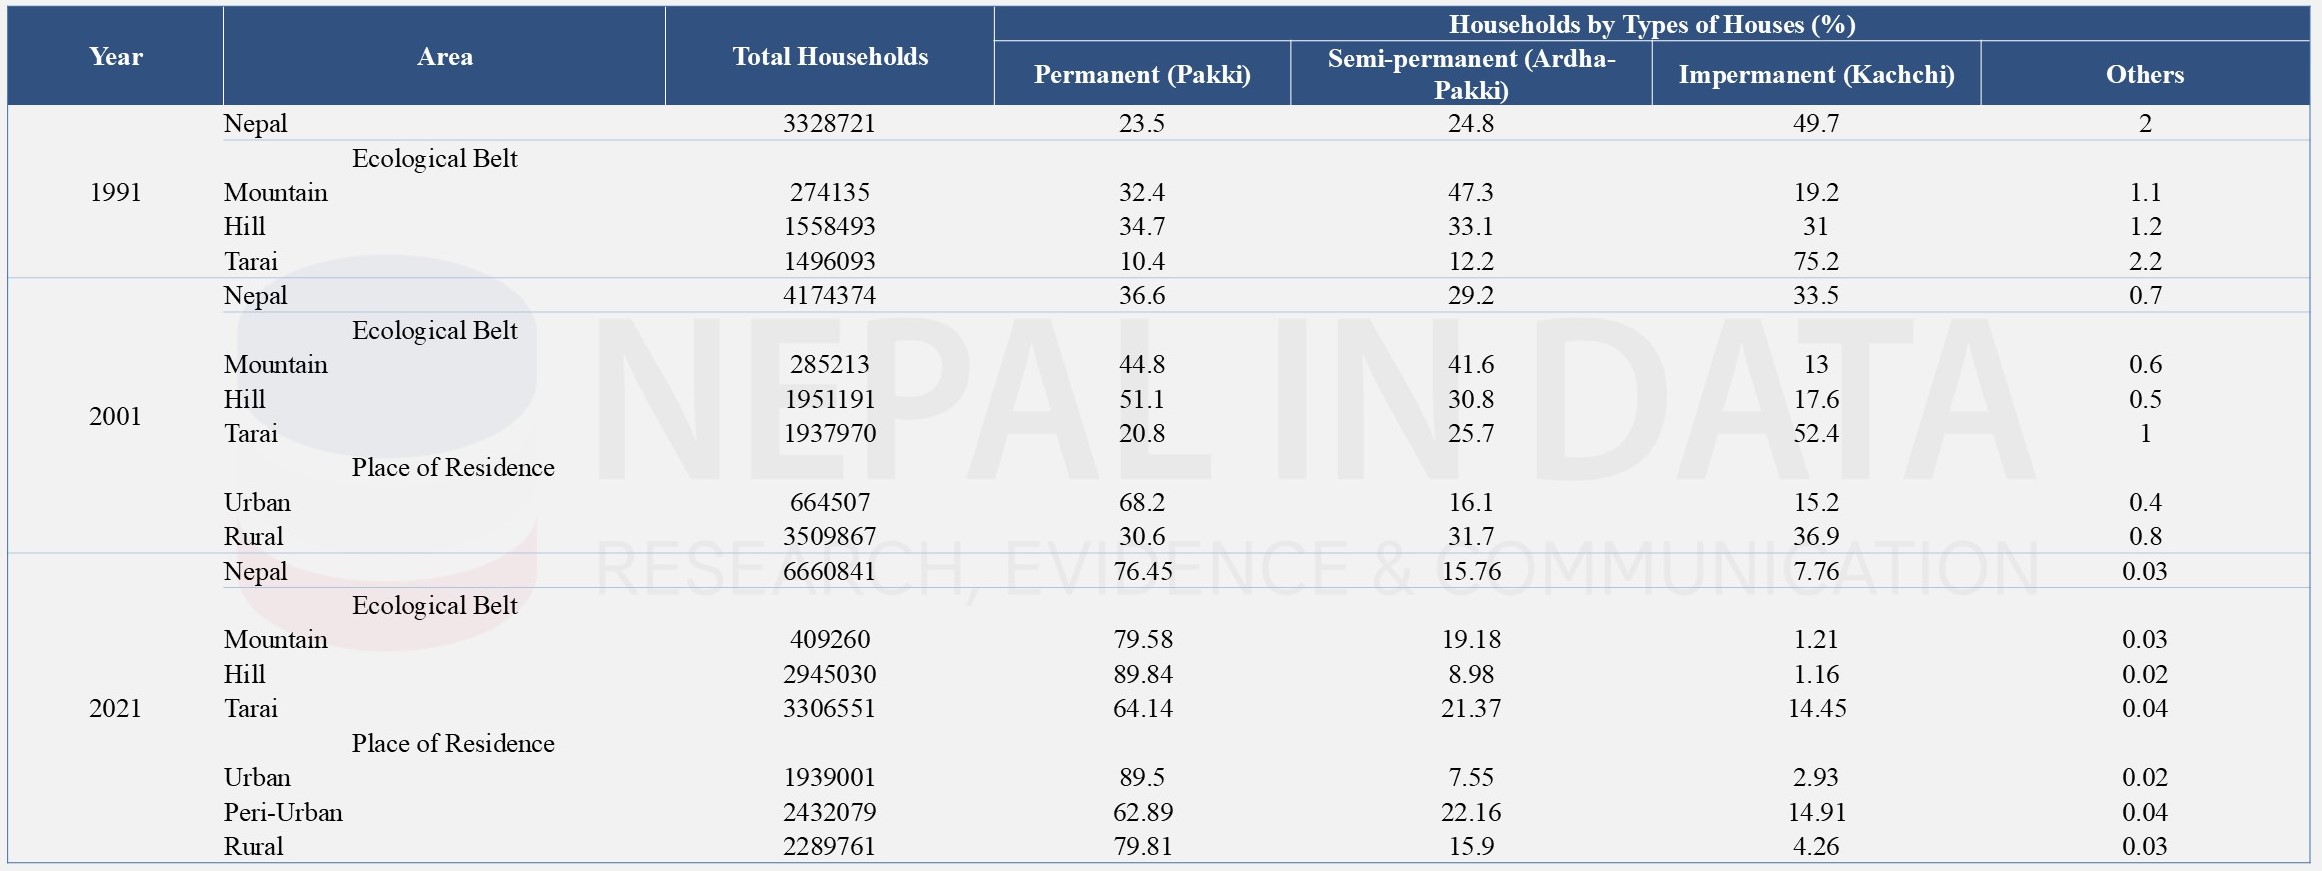
Table 2 presents the distribution of households by type of house in Nepal across three census years. Urban areas saw a sharp increase in permanent housing, with 89.5% in 2021, while rural areas also improved significantly to 79.81%. This data reflects a trend toward more permanent housing across all ecological belts and areas of residence in Nepal over the last three decades.
Table 2: Percentage Distribution of Households by Types of Houses, Nepal, 1991-2021
Source: National Population Census, 2021, Reports, National Statistics Office (NSO)
Lighting Facilities
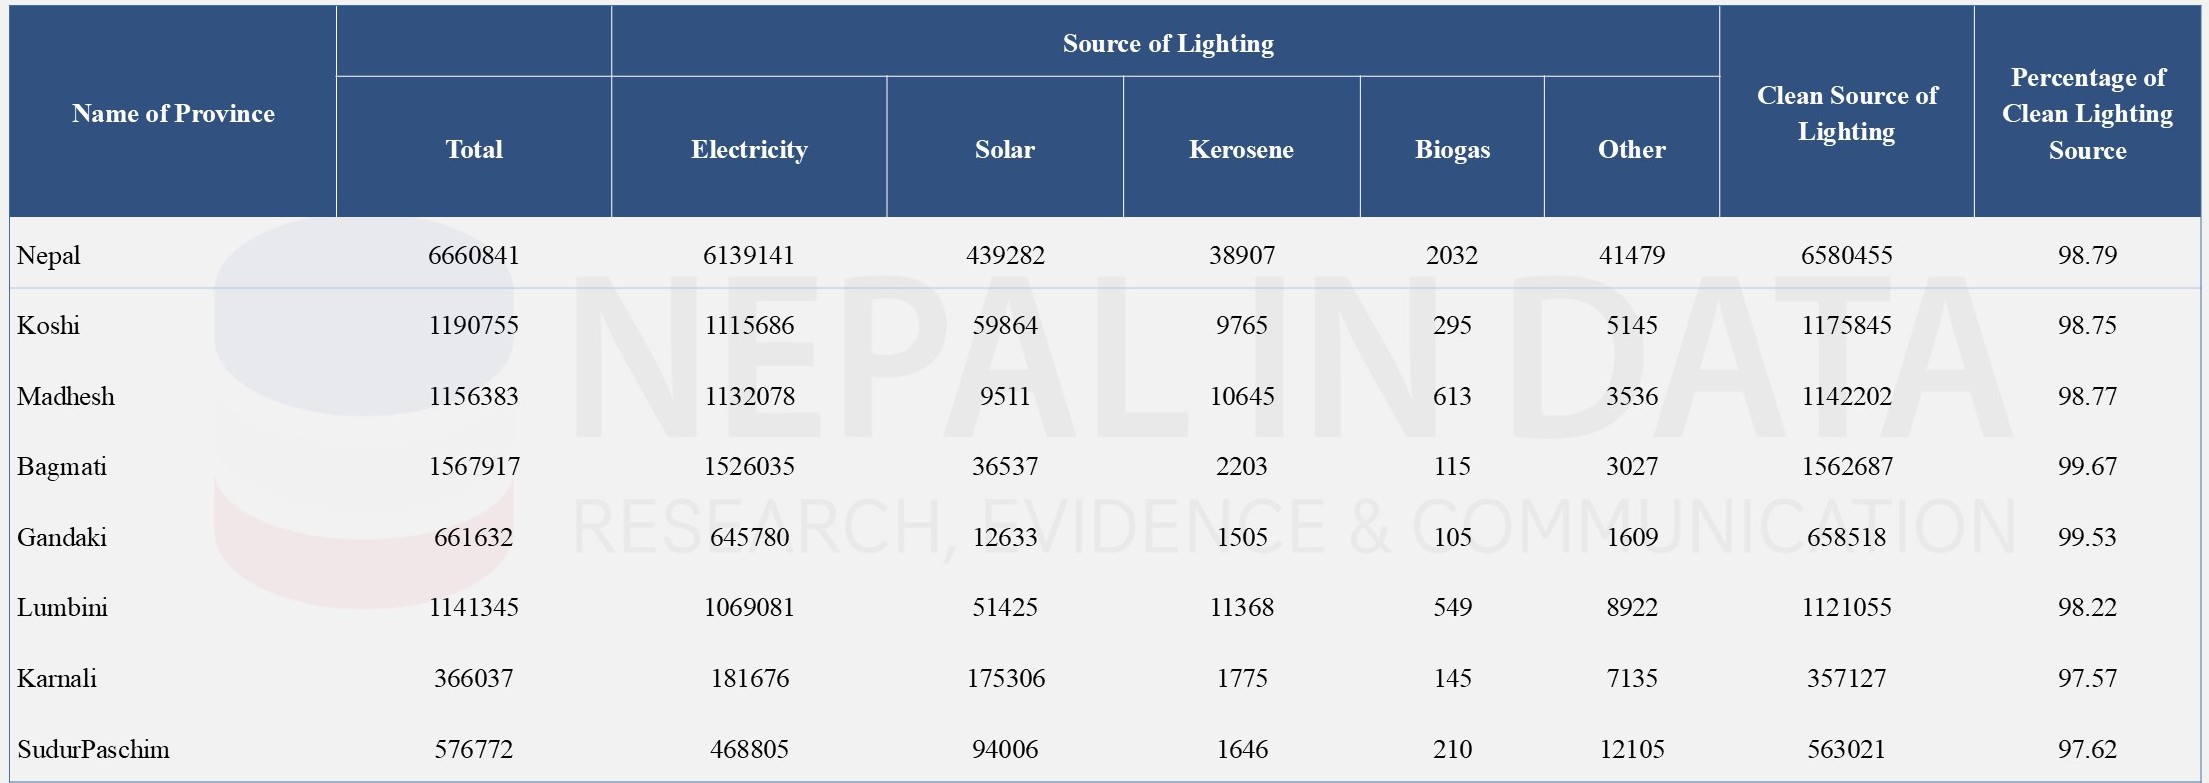
Table 3 presents that Nepal has made significant achievements in access to clean lighting sources (electricity, solar, biogas) with an overall clean lighting percentage of 98.79%. The data shows that the Bagmati and Gandaki provinces achieved the highest percentages of clean lighting and other provinces have also continuously improved.
Table 3: Households by Type of Lighting Facilities, Nepal, 2021
Source: National Population Census, 2021, Reports, National Statistics Office (NSO)
Main Fuel Used for Cooking
Table 4 presents that Nepal is still heavily dependent on traditional cooking fuels, nearly 46 percent of the households are using clean cooking fuels (LPG, electricity, and biogas). It varies significantly across provinces. Policies should focus on promoting cleaner alternatives, especially in provinces with lower adoption rates like Karnali and Sudurpaschim provinces to enhance energy sustainability and public health.
Table 4: Households by Type of Main Fuel Used for Cooking, Province Level, 2021
Note: Clean sources of cooking fuel include LPG, electricity, and biogas
Source: National Population Census, 2021, Reports, National Statistics Office (NSO)
Main Source of Drinking Water
Table 5 indicates that nearly 93 percent of Nepal's population has access to safe drinking water, but it varies among provinces. To provide 100 percent safe drinking water across Nepal should prioritize infrastructure development for reliable water sources, increase public awareness of water safety, and promote sustainable practices for water management.
Table 5: Percentage Distribution of Households using Main Sources of Drinking Water, Nepal, 2021

Source: National Statistics Office, Population Census Reports, 2021
Toilet Facilities
The following Table 6 shows the distribution of households by toilet facility across the provinces of Nepal. Up to now, 5 percent of households have no access to toilet facilities and 30 percent of households use ordinary toilets. There is a disparity in the provinces, particularly in Karnali and Madhesh. Public awareness programs should be conducted on sanitation practices and provide financial support for low-income households to build or upgrade their toilet facilities.
Table 6: Distribution of Households by Toilet Facility, Nepal, 2021
Source: National Statistics Office, Population Census, 2021
Farm Population
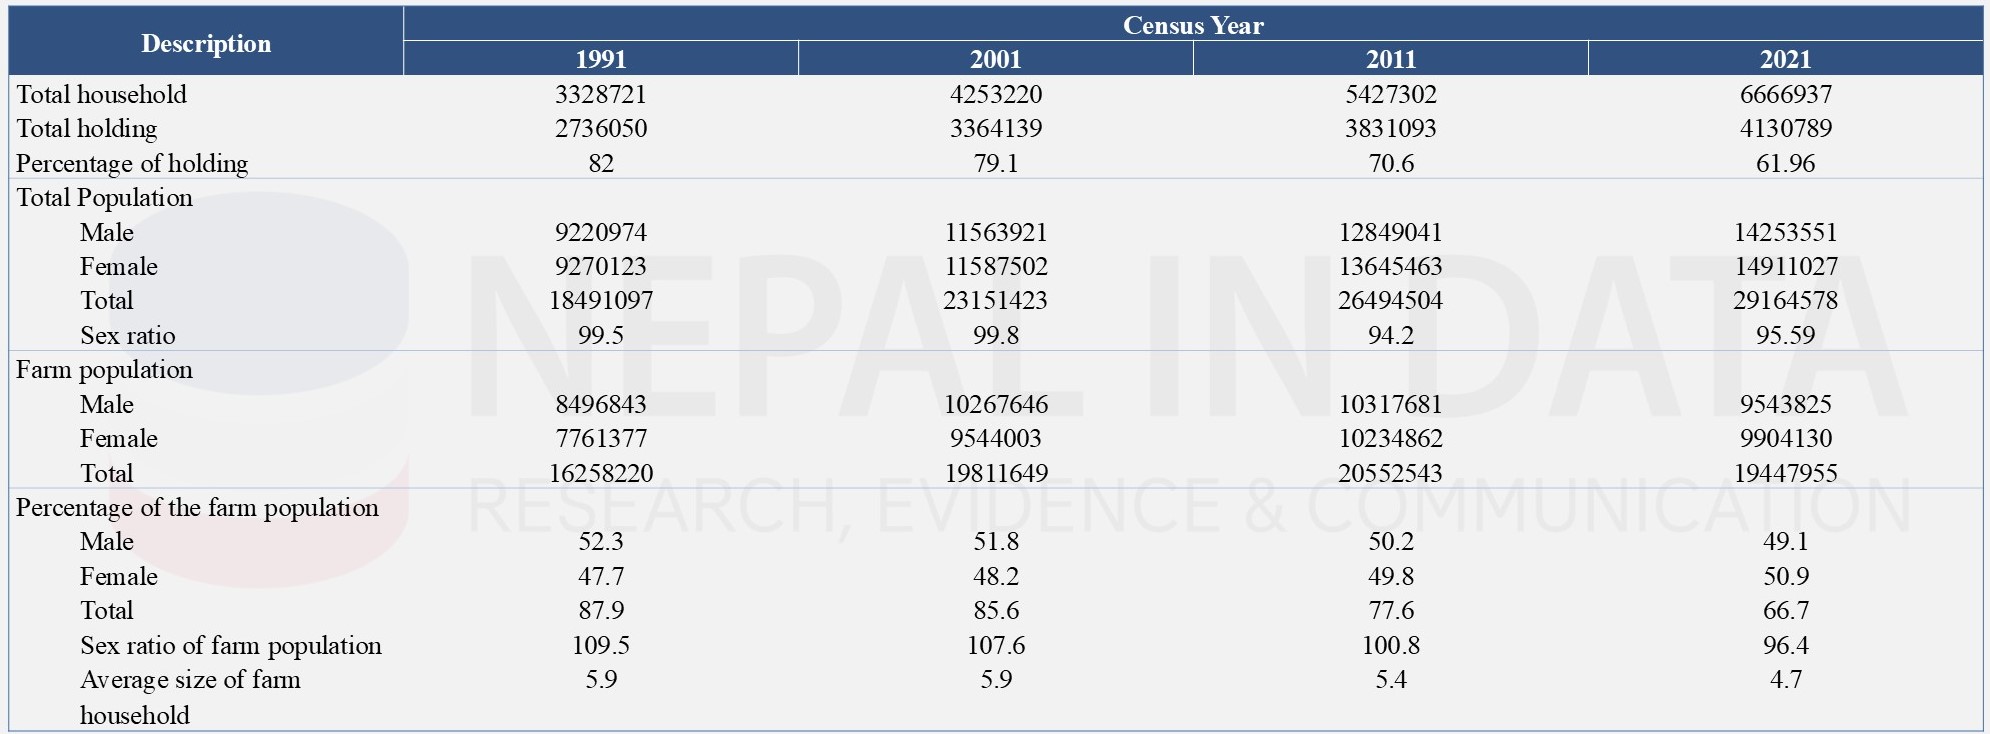
The following Table 7 presents the comparative analysis of the farm population (agriculture-related population) in different census periods. The farm-related indicators are decreasing continuously, which indicates that the households and population are shifting their occupation from farm activities to non-farm activities. To address the declining trend in agricultural participation, it is needed to implement a program to increase agricultural productivity and access the market. This may also reduce the trend of outmigration from rural areas.
Table 7: Farm Population 1991/92-2021
Source: National Statistics Office, Population Census, 2021
Road Length
Table 8 presents the total length of roads covered by national highways with different road categories and ongoing construction and planned expansions of roads at the province level. It indicates the need for investment to convert the graveled and earthen road to Blacktop. Similarly, under construction roads should be completed on time.
Table 8: Road Length with Category and Pavement (In Kilometer) Year: 2020
Source: Statistics of National Highway SNH 2022/23, Department of Road
Vehicles Registered
The following Table 9 shows the vehicle registration of Nepal. The data indicates that significant increase in vehicle registrations with motorcycles and cars/jeeps/vans dominating the total count, reflecting a growing trend toward personal and commercial vehicle use over the years. The government should give priority to public transport management to manage the rapid increase in vehicle registration. Similarly, it is needed to update and strictly implement vehicle emissions policy nationwide for environmental health.
Table 9: Number of Vehicles Registered, 2001/02- 2022/23*
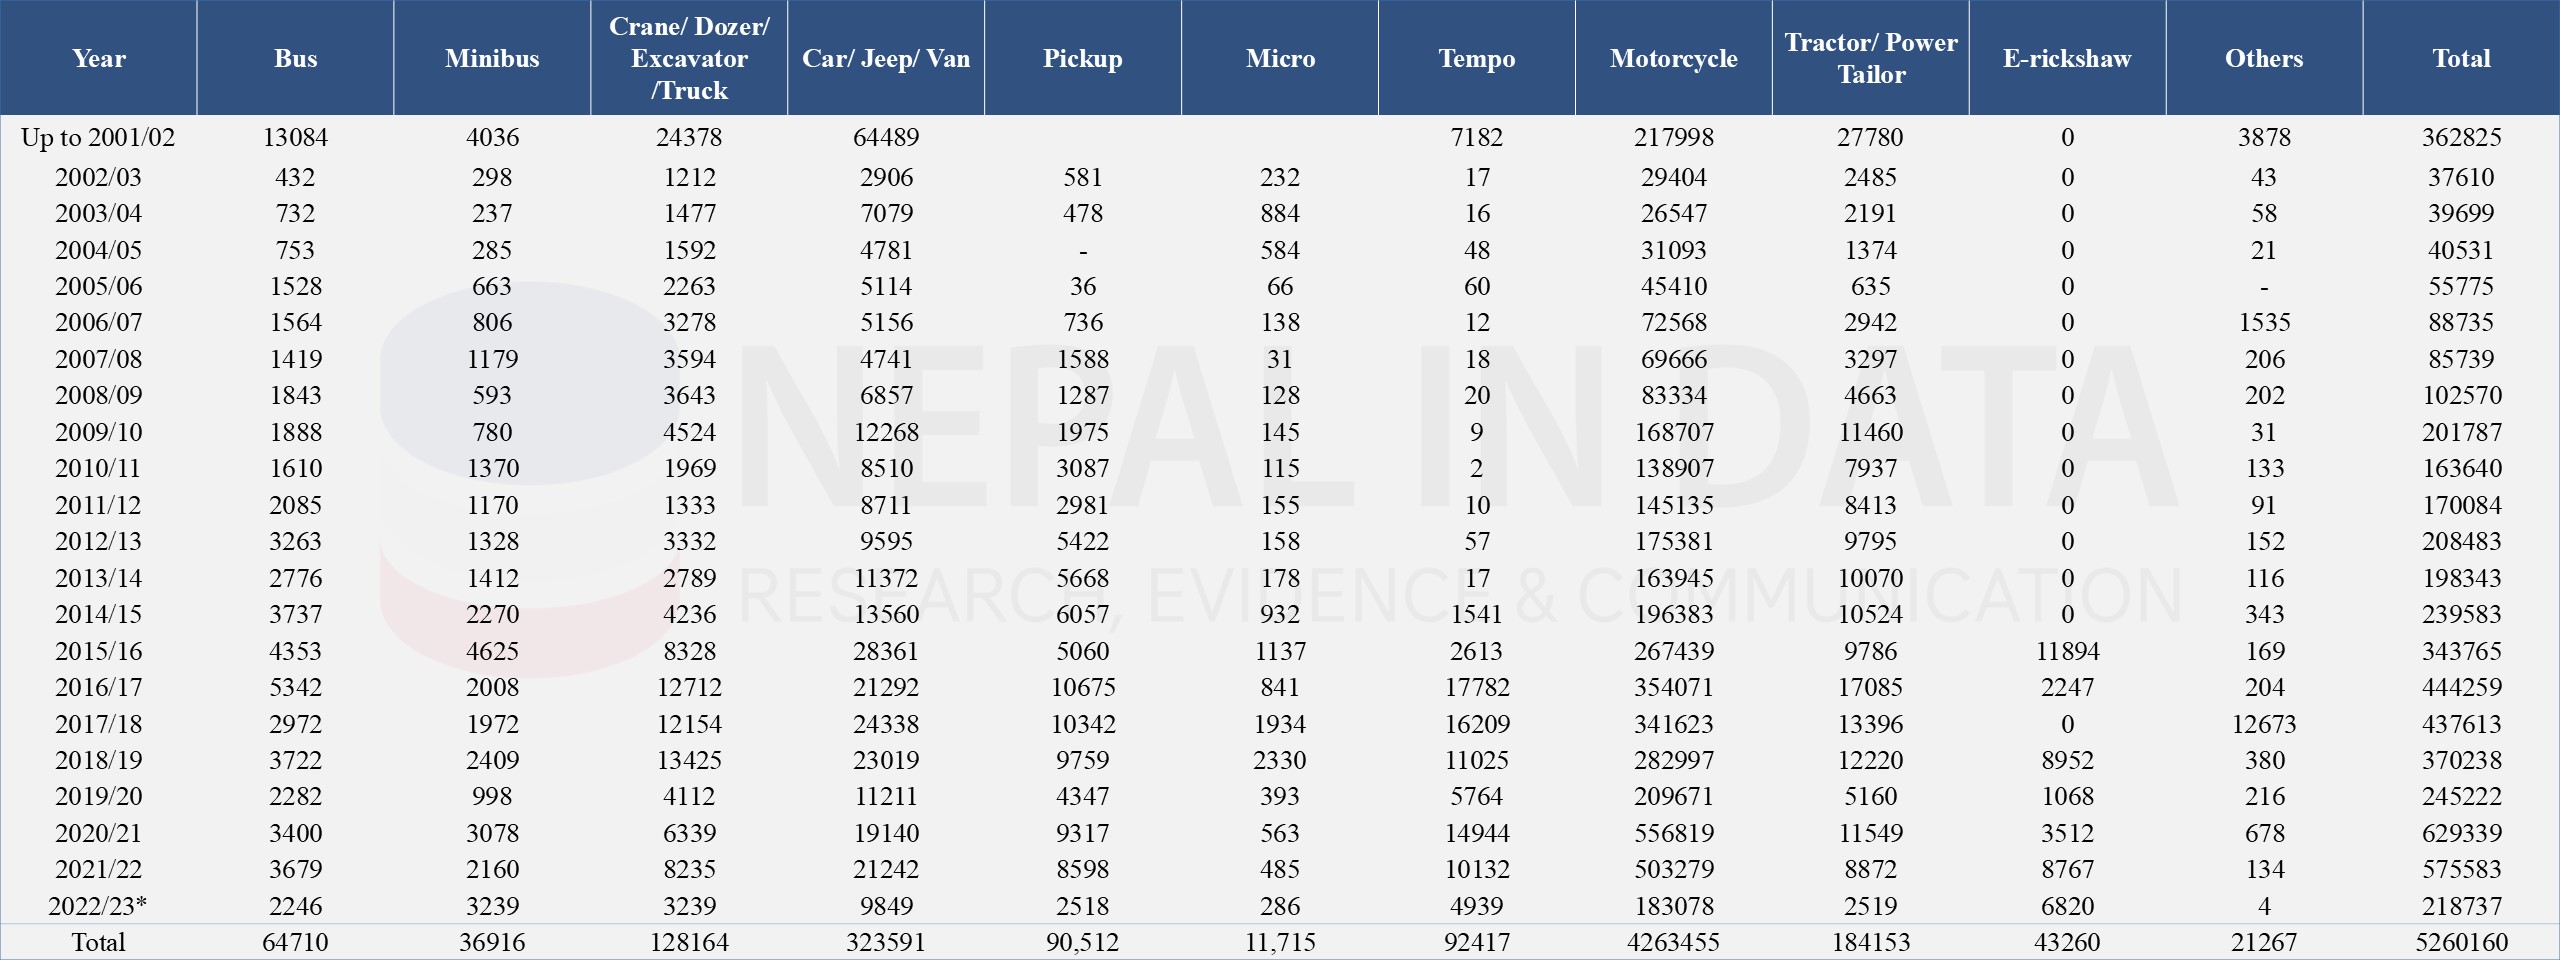
Source: Department of Transport Management.
Environmental Health (Impact on Human Health)
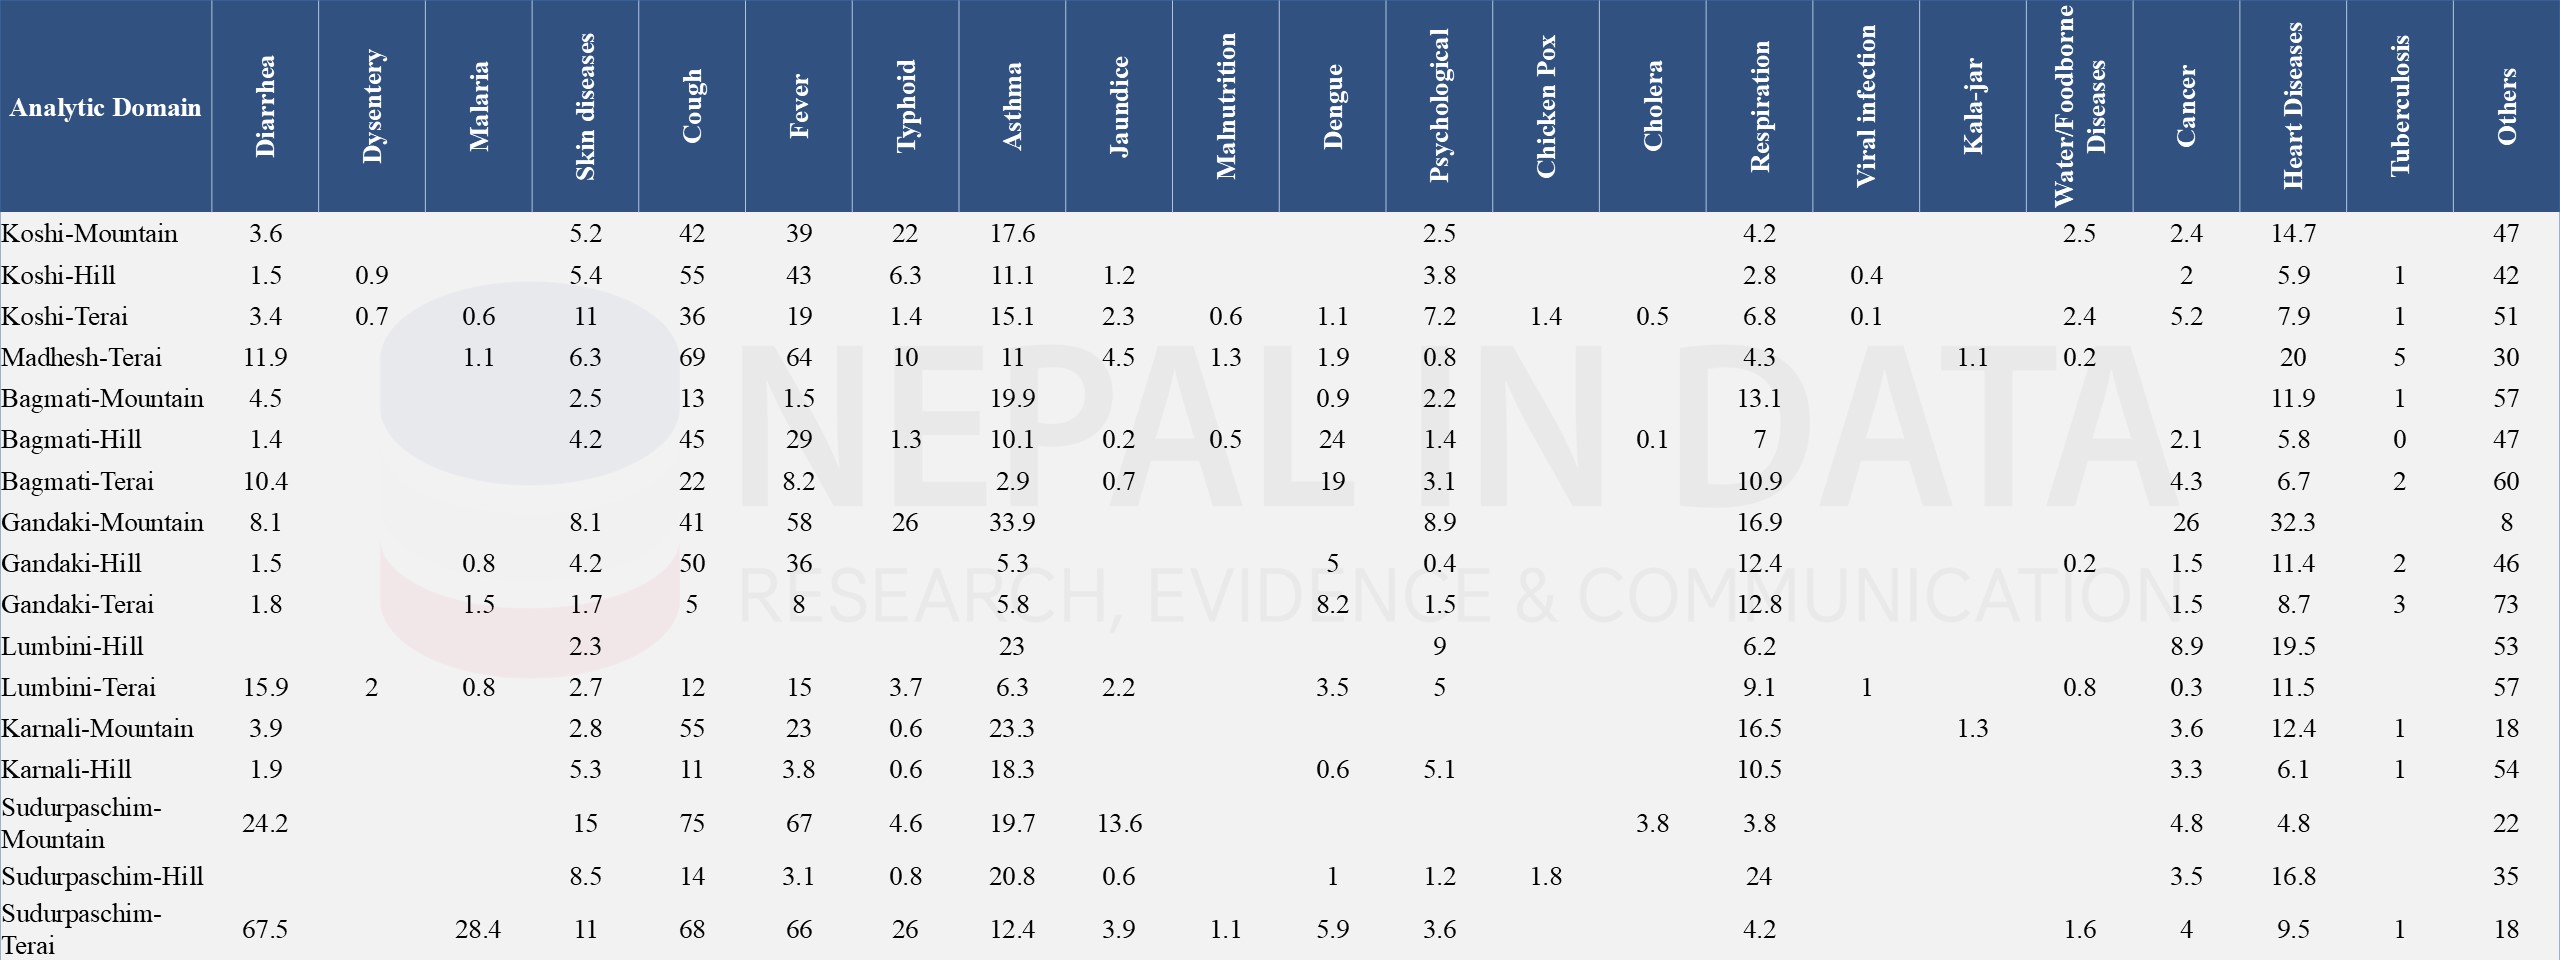
Major concern for the challenges of environmental health in Nepal is air and water pollution, deforestation, waste management, and the impacts of climate change. The following Table 10 and Table 11 provide an overview of disease prevalence within Nepalese households over the past 25 years. Cough and fever stand out as the most widespread diseases. The data shows that there is a variation in the incidence of diseases across the different ecological as well as provincial zones.
Table 10: Increase in Incidence of Disease in the Last 25 Years, 2022
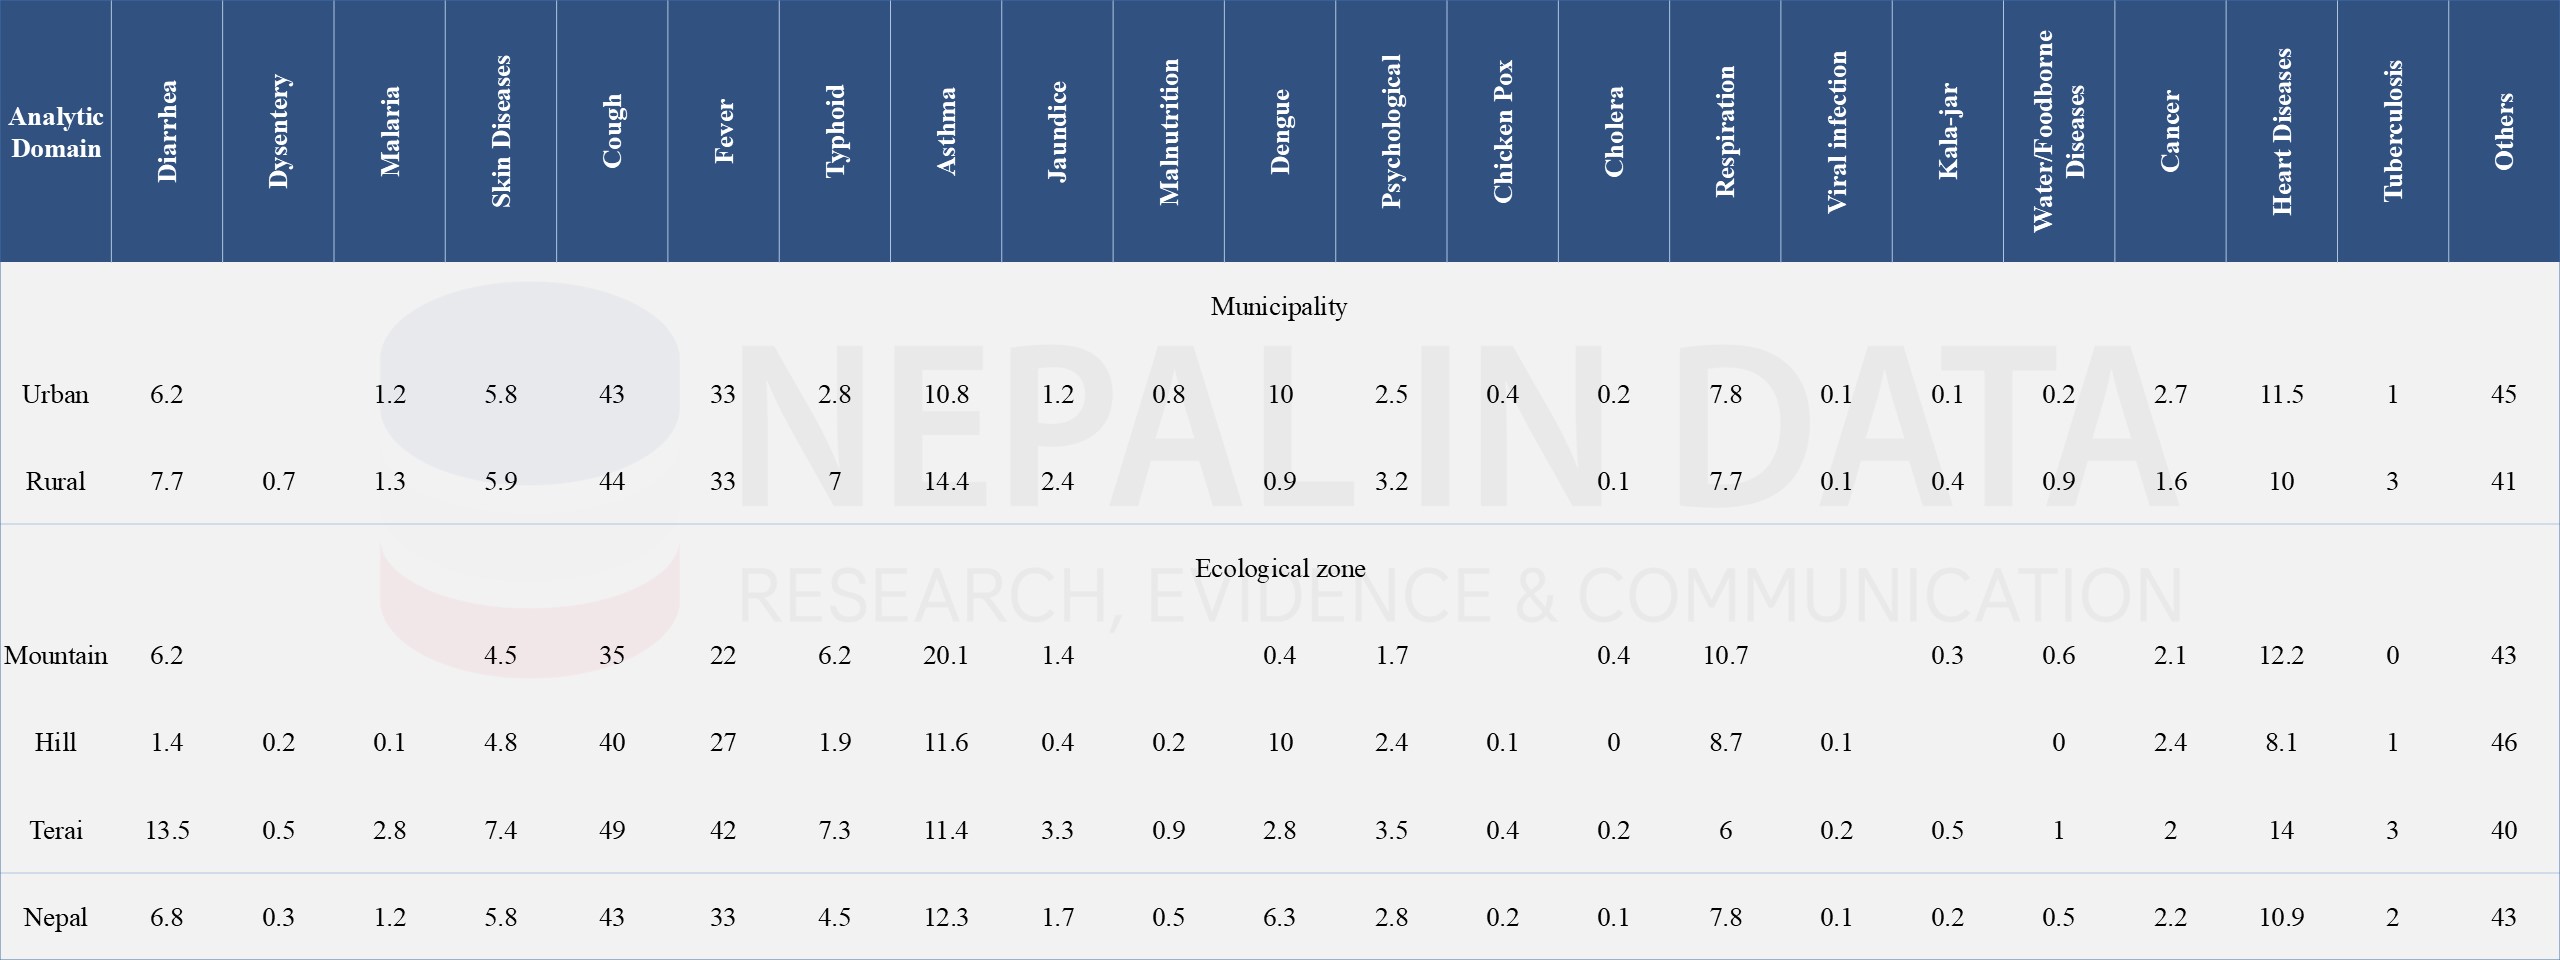
Table 11: Increase in Incidence of Disease in the Last 25 Years in Different Minor Ecological Belts, 2022
 Source: National Climate Change Survey, 2022, National Statistics Office (NSO)
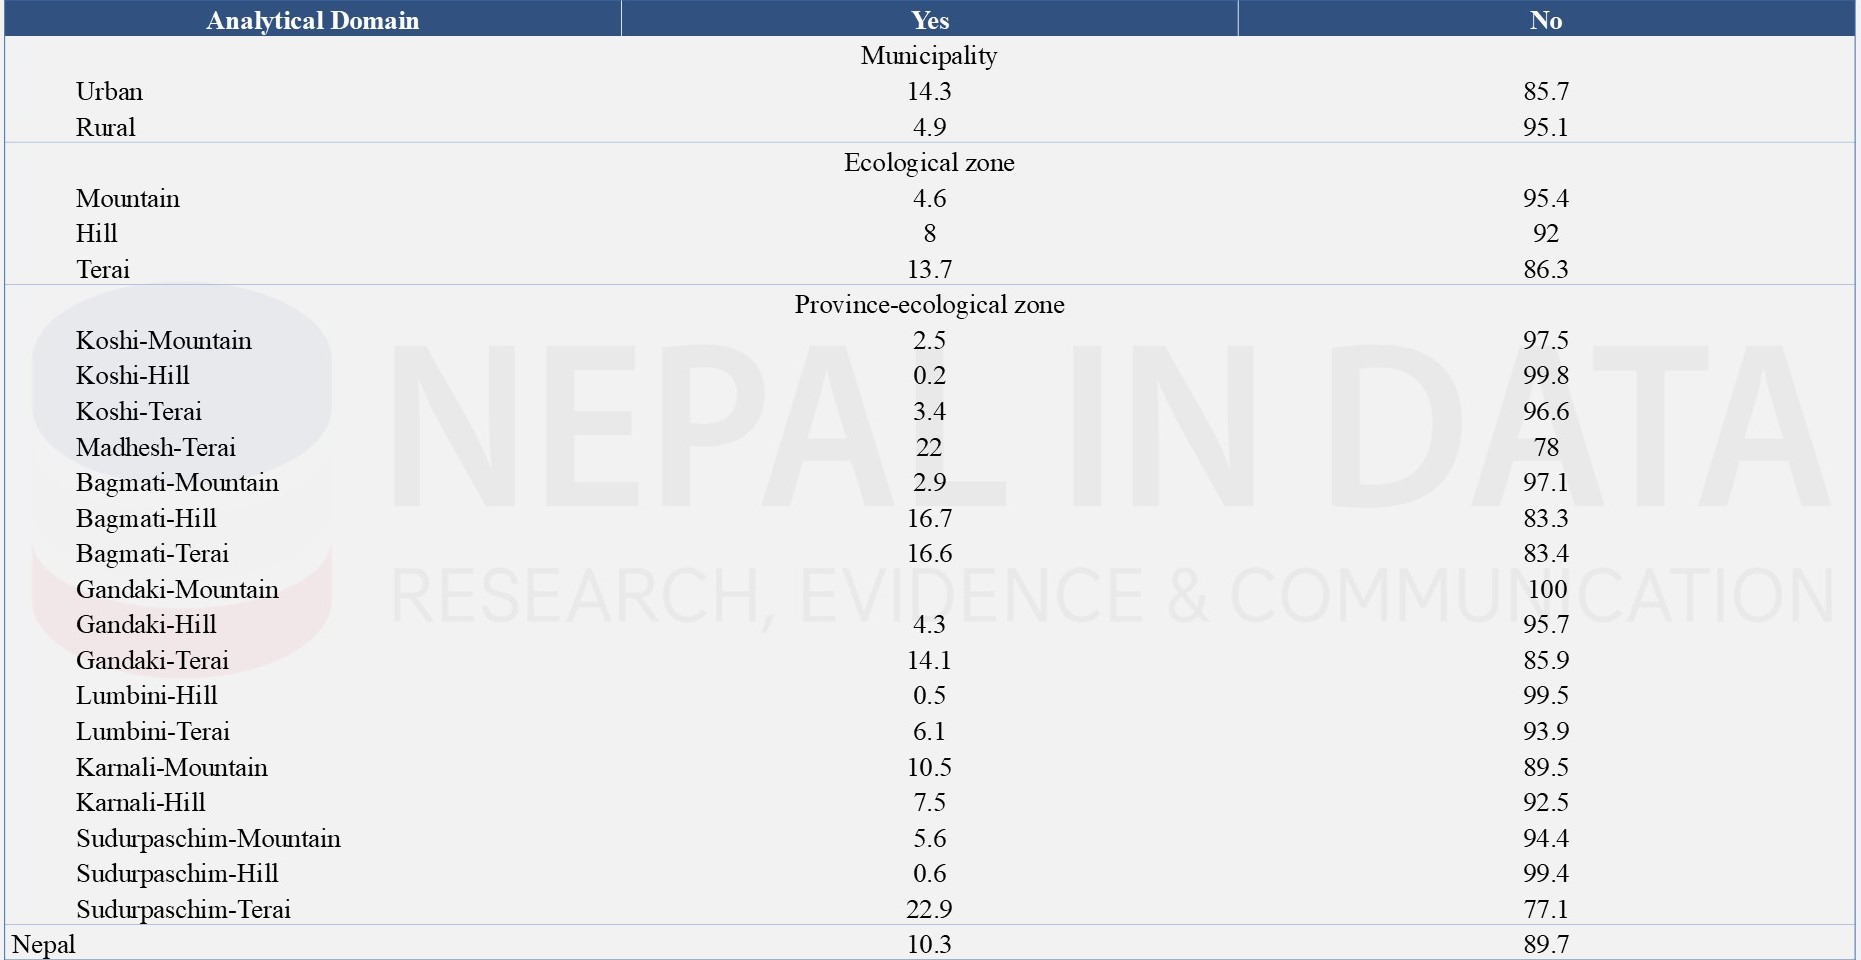
Table 12 provides an overview of the increasing incidence of vector-borne diseases in Nepal over the last 25 years. Urban municipalities are more suffering from vector-borne diseases. Across ecological zones, the Terai region has the highest incidence. In the province-ecological zone, Sudurpaschim-Terai prevails more with vector-borne disease.
Table 12: Increase in Incidence of Vector-Borne Diseases (%) in the Last 25 Years, 2022
Source: National Climate Change Survey, 2022, National Statistics Office (NSO)
Table 13 shows the percentage of households with the incidence of water-borne diseases in Nepal over the past 25 years. Among ecological zones, the mountain zone has the highest incidence of waterborne diseases and in the province-ecological zone, Karnali Hill has the highest incidence. Policies targeting high-incidence areas, particularly in the Karnali region, should focus on reducing the prevalence of water-borne diseases and enhancing access to clean water and sanitation.
Table 13: Increase in Incidence of Water-Borne Diseases in the Last 25 Years, 2022
Source: National Climate Change Survey, 2022, National Statistics Office (NSO)
Environmental Health (Impact on Crops and Livestock)
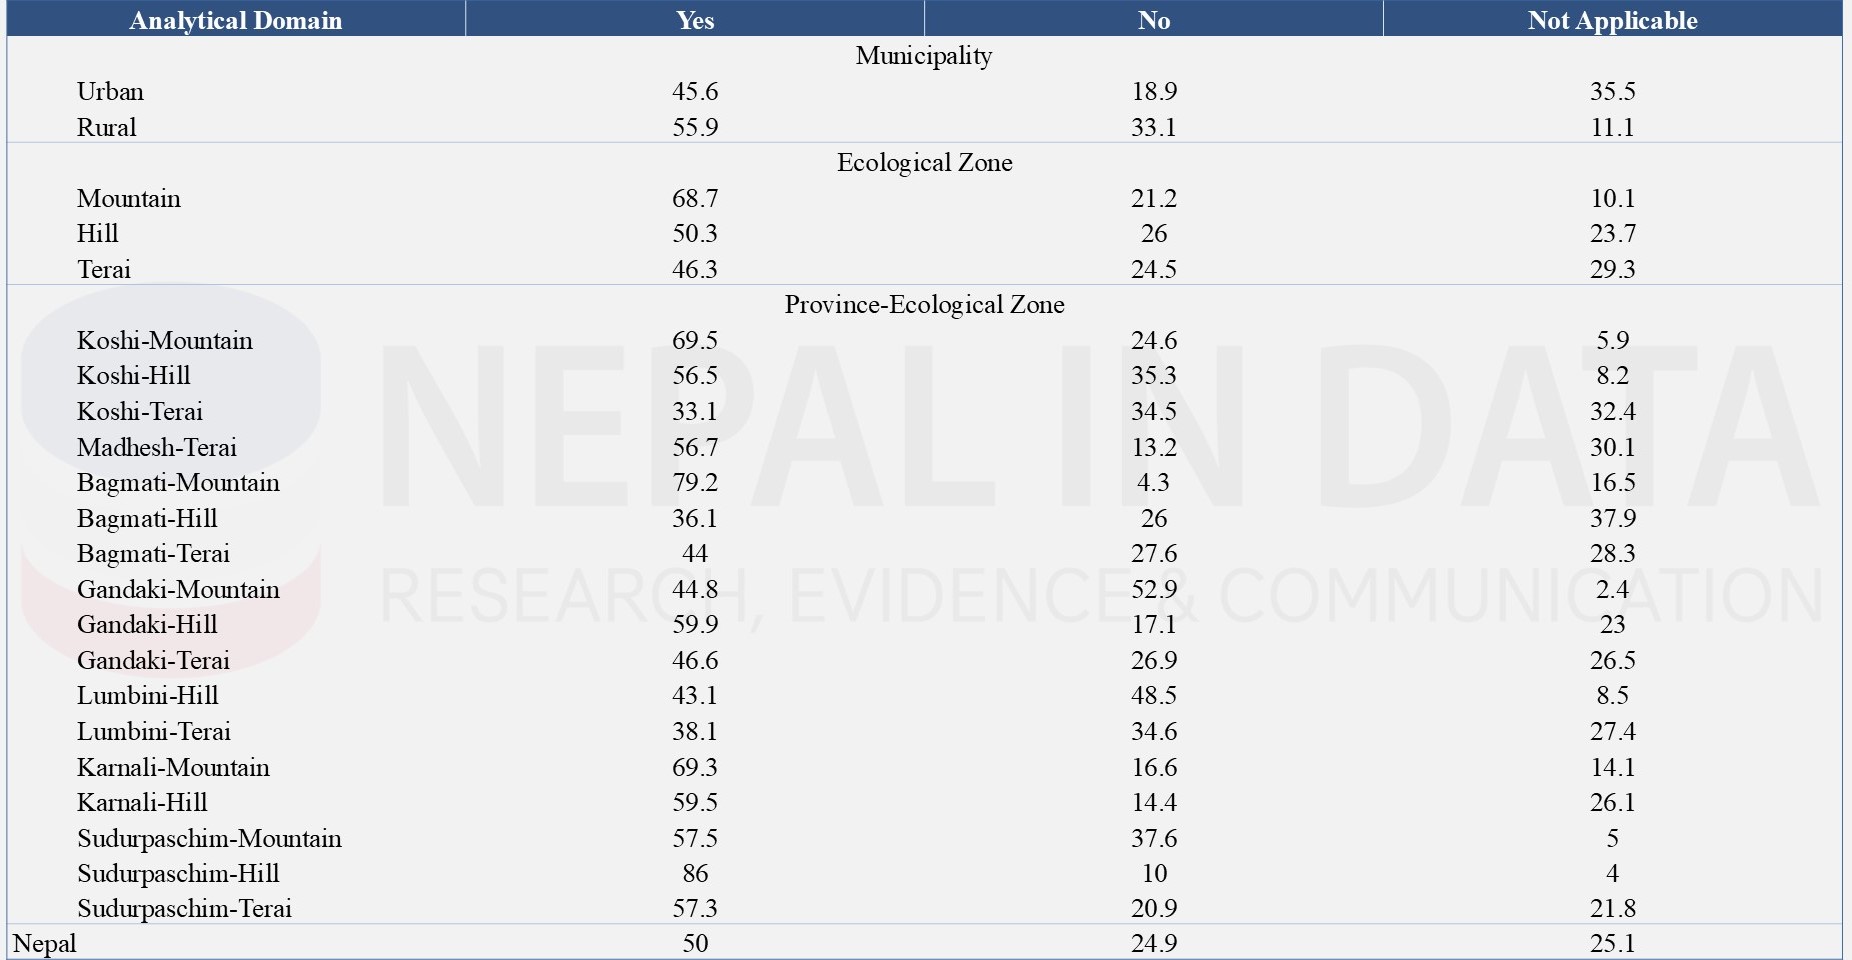
Table 14 provides an overview of households' responses to the occurrence of new crop diseases over the past 25 years. Nearly 50 percent of the households reported the emergence of new crop diseases. This shows the significant impact on crops posing new threats to crops in various communities and geographic locations due to changing climatic conditions.
Table 14: Emergence of New Crop Diseases (%) in the Last 25 Years, 2022
Source: National Climate Change Survey, 2022, National Statistics Office (NSO)
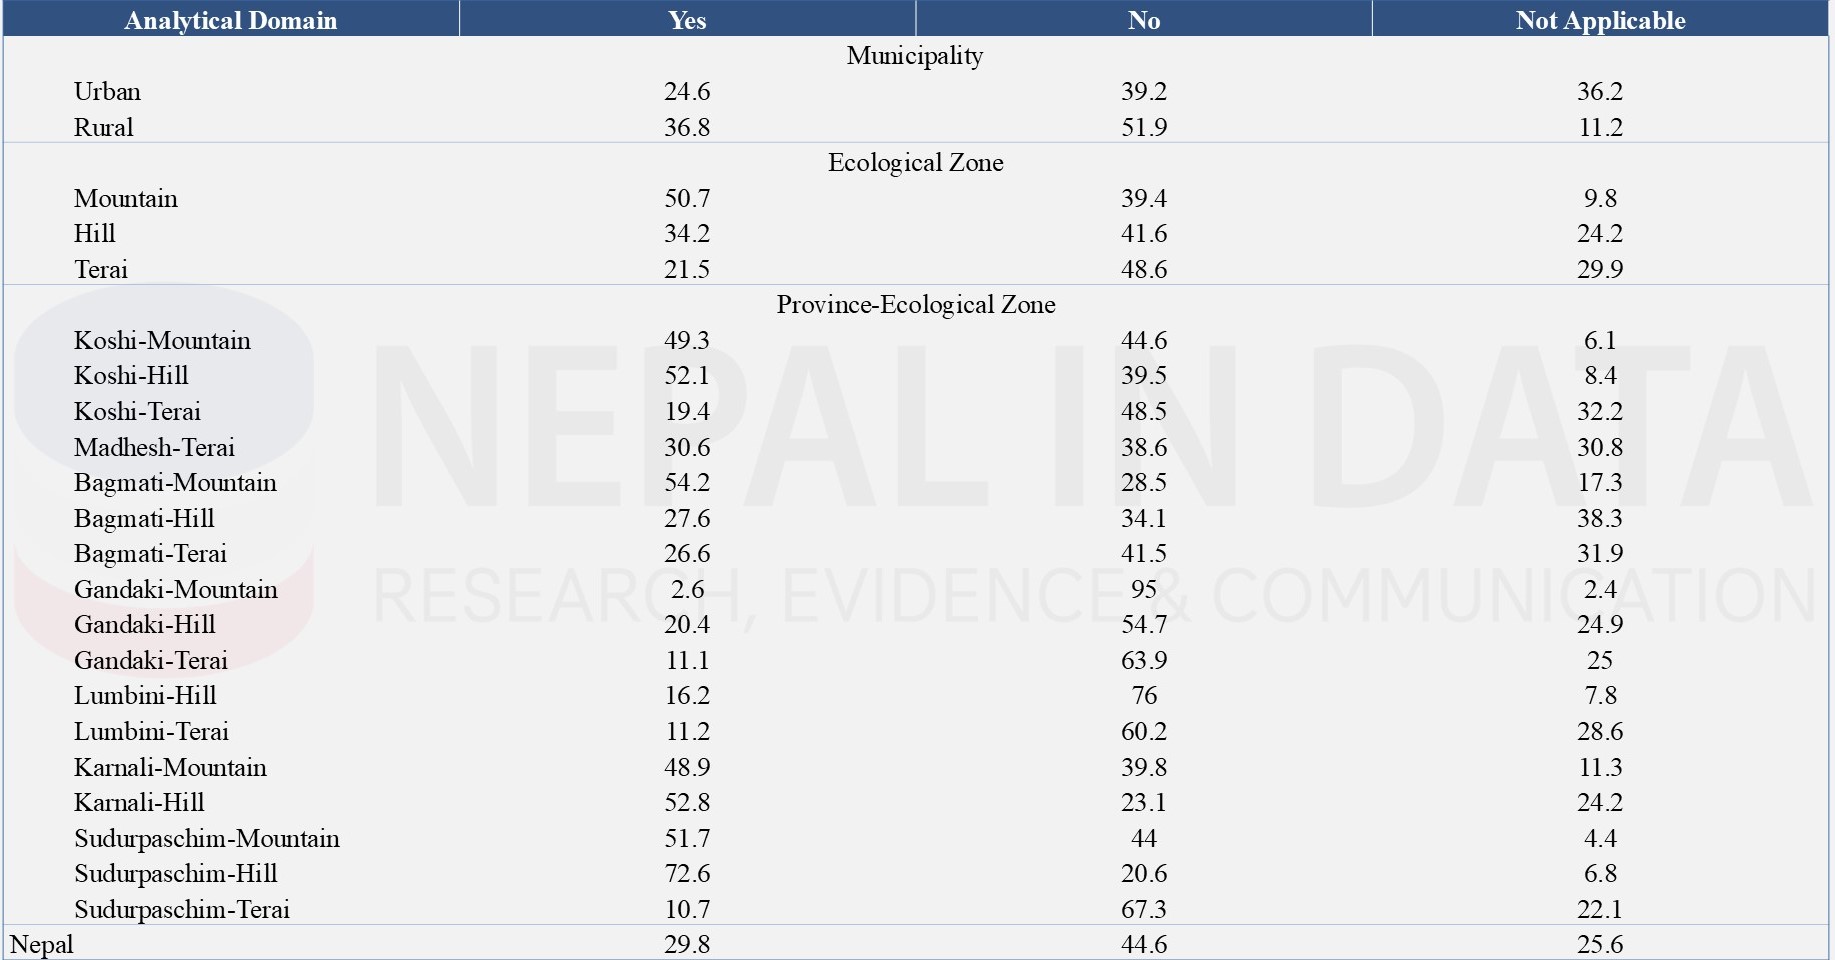
Table 15 provides an overview of the percentage distribution of households experiencing new diseases in livestock over the past 25 years. Over half of households in the mountain region reported suffering from new diseases in their livestock. Due to the impact of climate change, new diseases are experienced by the respondents on their livestock in different ecological and provincial zones of Nepal.
Table 15: Emergence of New Diseases (%) in Livestock in the Last 25 Years, 2022
Source: National Climate Change Survey, 2022, National Statistics Office (NSO)
Poverty
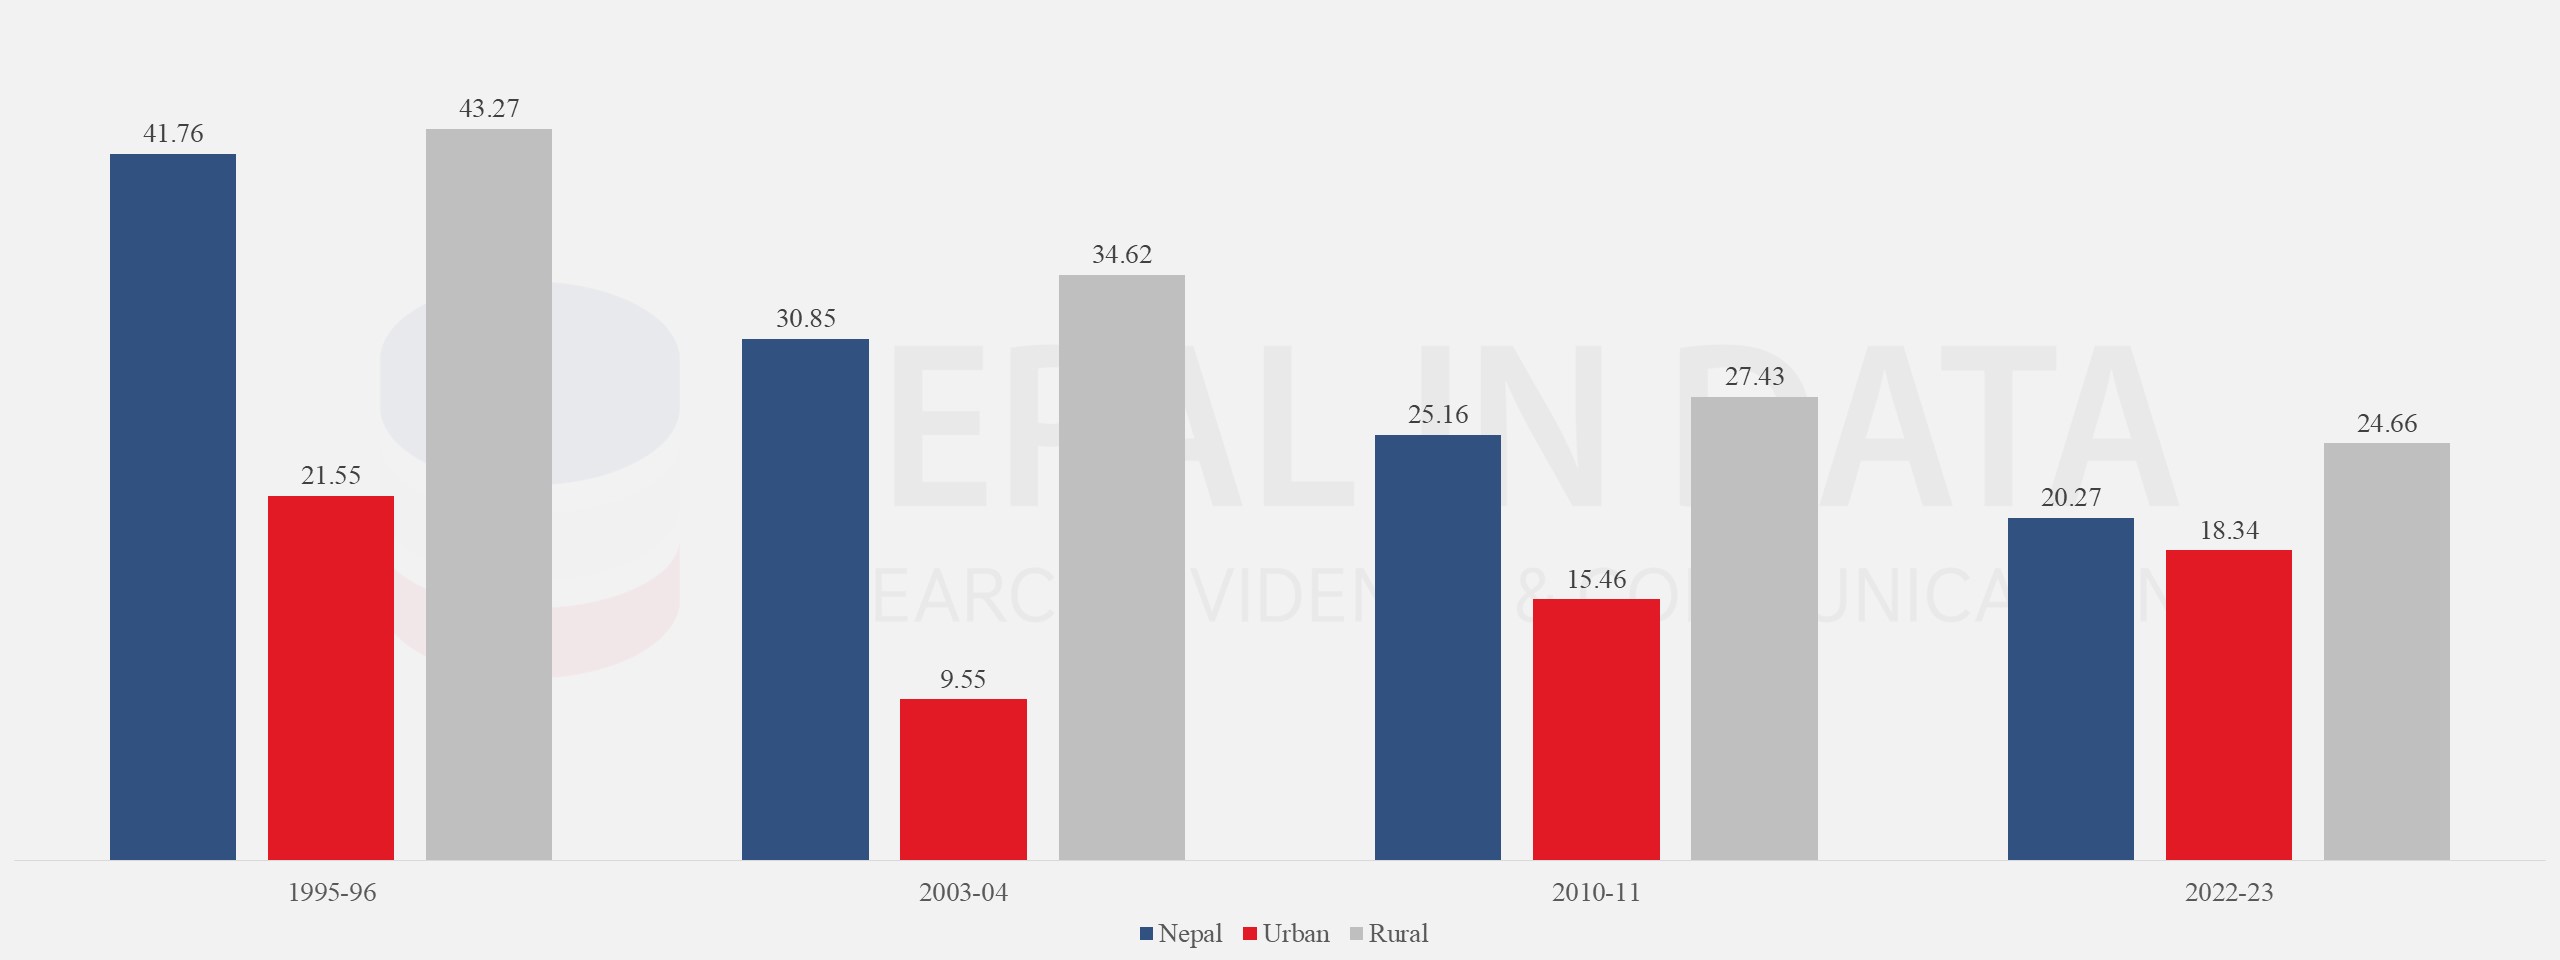
Nepal’s poverty line is defined using the Cost of Basic Needs (CBN) approach. The following Chart indicates Nepal's poverty headcount rate. Now, the poverty headcount rate in Nepal is 20.27. Poverty significantly decreased from 1995-96 to 2022-23 but there are disparities between urban and rural areas.
Chart 3: Poverty Headcount Rate in Nepal
Note: Numbers for 1995-96 and 2003-04 are based on the 1995-96 poverty line 2010-11 are based on the 2010-11 poverty line and 2022-23 are based on the 2022-23 poverty line.
Source: Nepal Living Standard Survey, 2022/23, National Statistics Office (NSO)
There is a significant difference in the incidence of poverty across the seven provinces. The poverty rates are higher than the national rate in four of the seven provinces. The poverty rate is highest in Sudarpaschim, followed by Karnali. The poverty depth and severity are also higher in provinces with a higher poverty headcount.
Table 16: Provincial Poverty, 2022-23
Source: Nepal Living Standard Survey, 2022/23, National Statistics Office (NSO)
Miscellanies
The following table presents the statistics on crime, corruption, and traffic accidents in Nepal from 2012/13 to 2022/23. In these 11 years, Nepal experienced a significant increase in crime cases, corruption cases, and traffic accidents. To address the rising trends in crime, corruption, and traffic accidents in Nepal, law enforcement resources should be enhanced, comprehensive anti-corruption measures implemented, and traffic safety initiatives should be invested in, including public awareness campaigns and infrastructure improvements.
Chart 4: Statistics on Crime, Corruption, and Traffic Accidents in Nepal

Key Takeaways
Human population that resides in a settlement, and uses the services (water, sanitation, energy, transport, etc.) is facing significant challenges and exposure to potentially dangerous environmental conditions in Nepal. Rapid urbanization, unplanned land use, and insufficient infrastructure are the major causes of pollution, poor sanitation, and migration. To address these challenges, the focus should be on an integrated housing and settlement policy, promoting sustainable urban planning, and providing incentives for retaining households in the mountains and hills to discourage mismanaged migration.


